11 Dec 2024
Eurex
Focus on VSTOXX® Derivatives | November 2024 recap
- Performance across the equity indices was mixed in November, with SX5E struggling most of the month while DAX enjoyed a nice rally. SXXP stayed somewhat in the middle
- Implied volatility markets all fell sharply at the start of the month, with risk premium priced into these markets evaporating as the US election passed. Most volatility markets moved to be trading in line with their realized volatility ahead of year-end
- Skew was very much benign, with no particular demand or supply standing out
Monthly Volatility Update
November 2024 was certainly a busy month for catalysts. While many may focus on, and remember, the US election, which may have global implications with the possibility of tariffs even on allies and trading partners, Europe had many of its own catalysts during the month. None was perhaps bigger than France’s budget battle, which saw OAT-Bund spreads widen to their widest since the Great Financial Crisis. Perhaps this is why the pan-European indices struggled to keep up with international counterparts and why the volatility markets stayed relatively firm while collapsing in other regions.
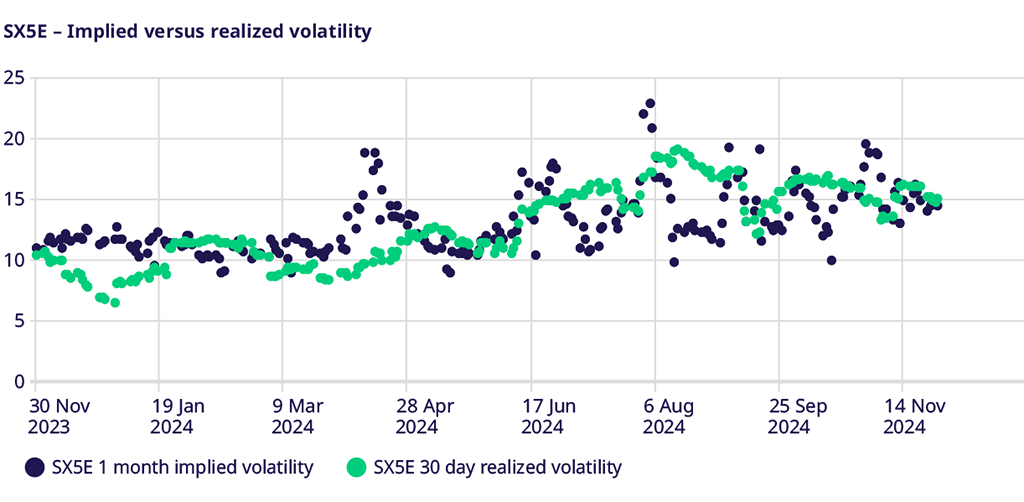
SX5E struggled throughout the month but recovered late to end November down about 50 basis points. That masks some inter-month weakness, which saw the index down almost 3% at one point. Initially, implied volatility in SX5E fell sharply in the week following the US election, as did implied volatility in all major asset classes. However, given some idiosyncratic European issues, implied volatility ground higher over the last two weeks and ended the month near the elevated levels seen at the end of October. Traders are pricing implied volatility reasonably in line with realized volatility, letting the gamma decide where it should be headed as we move into the end of the year when most prefer not to pay a lot of theta.
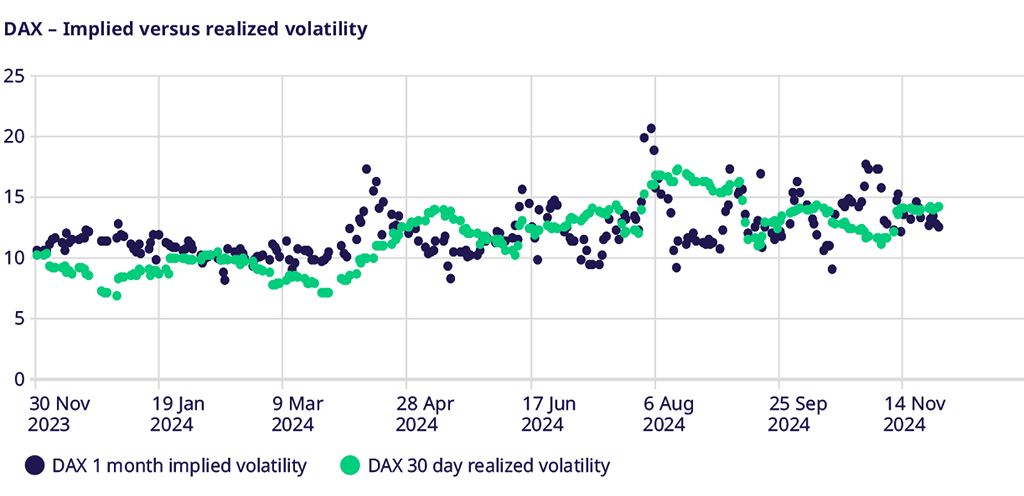
The DAX Index shook off the pan-European indices’ weakness and put together quite a strong month in November. After moving sideways for the first couple of weeks, a strong rally in the last two weeks saw the DAX close at the month's highs, up about 2.8%. Given the move in the underlying and the weakness in implied volatility across the pond, it should not be surprising to see the implied volatility of DAX options end the month at its lows. After beginning the month above 17, volatility closed the month below 13 as a vol crush, and a grind higher in stocks had traders looking to take off hedges in time for the year-end rally. It’s quite a different picture in the DAX compared to other parts of Europe.
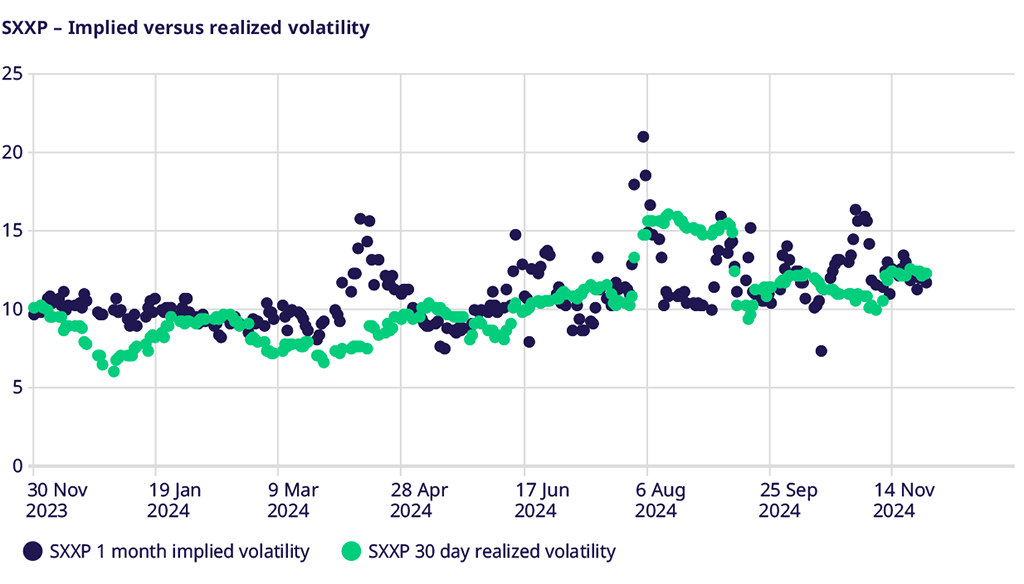
STOXX® 600 was a mixed picture, following the SX5E to the lows at the midpoint of the month, down 1% at one point, before recovering to end the month up not quite 1%. Not as good as the DAX and not as bad as SX5E, the STOXX® 600 fell, not just in index performance but also on the implied volatility front. Implied volatility fell from the highs at the start of the month and then stayed pretty flat, around 12.0 from the midpoint until the end of the month. This level of implied volatility was very much in line with the level of realized volatility, as traders priced options at the level where they could break even trading spot. The end of the year is not a time to take big bets on gamma and theta, especially when many of the big catalysts for the year are in the rear-view mirror.
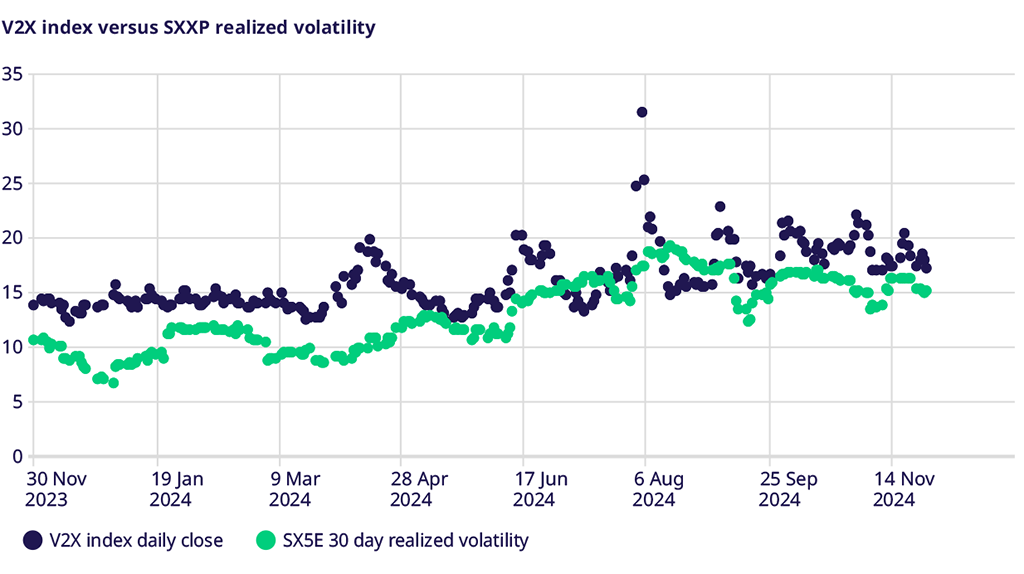
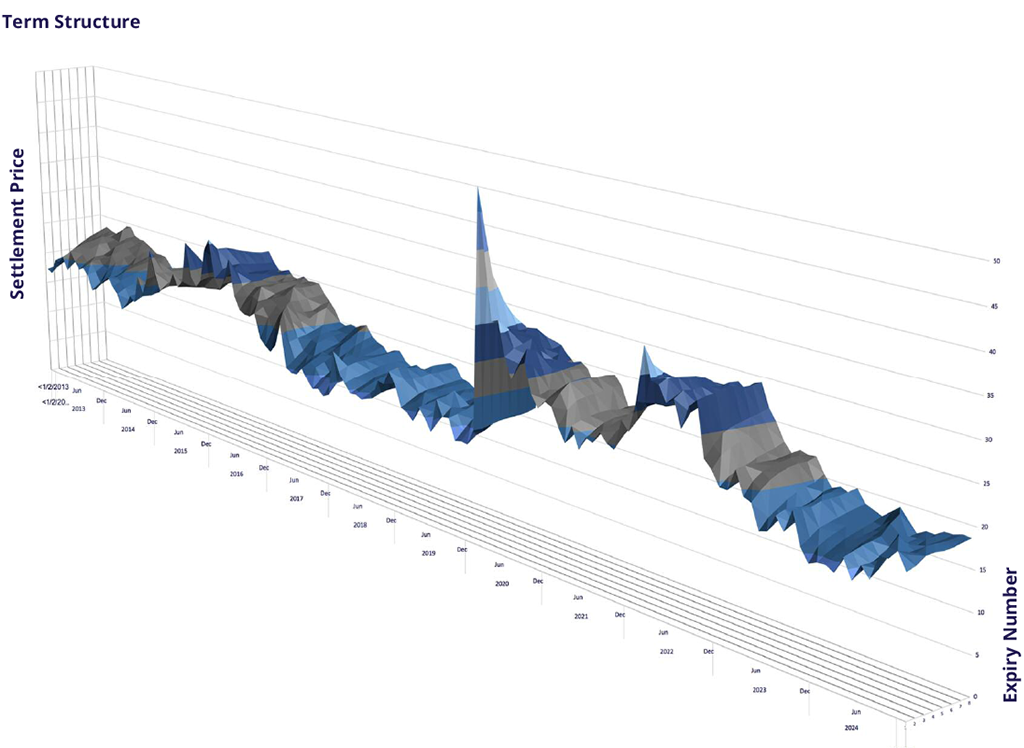
V2X proved its mettle as a hedging tool for European risk events. While participating in the early November implied volatility crush seen worldwide, falling from over 21 to under 17, the V2X saw a midmonth spike to move back above 20 due to the continental political events. There was some reprieve as markets moved into the end of the month and looked toward the year-end. However, as the chart above shows, the V2X index maintained a premium to realized volatility all month. Starting the month, V2X was about 6 vol points above realized; this fell to about 1 by midmonth. However, it rallied to 4 vol points again before settling about 3 vol points. I like to look at this implied-to-realized difference as a true measure of the risk traders perceived instead of simply looking at the headline index. This risk premium still indicates that, despite falling realized volatility, some traders still desire to hedge their European risk with the V2X.
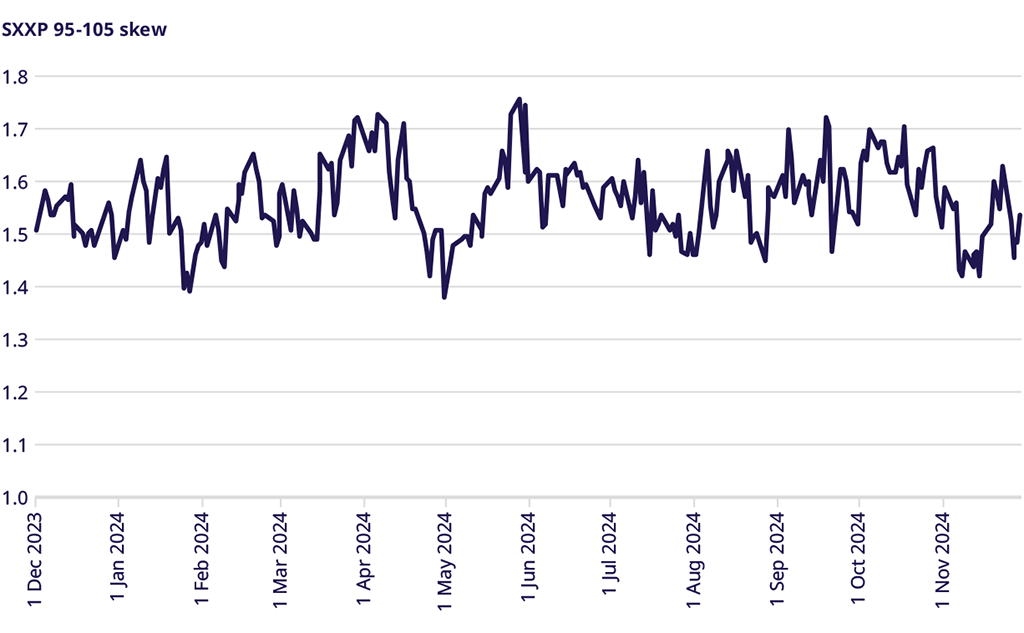
Skew markets showed no particular demand or supply of options once again. The difference between the 95% and 105% strikes has been trading in a relatively tight range between 1.45 and 1.65 vol points, with only an occasional move outside that band. While equity skew does remain a bit more stable than other assets, this level of stability suggests no pronounced demand for downside protection or any appetite to generate income by selling upside strikes. For traders so inclined, the relatively benign moves in skew despite more pronounced moves in the underlying can present some opportunities to find a better implementation of a directional view, whether long or short.
Trade the European volatility benchmark
Explore this year's macro events and find an overview of dates.
Volatility Views Podcast
Listen to the newest edition of the podcast by "The Options Insider" and get more information on this week's volatility markets and the VSTOXX® review and outlook.
For more information, please visit the website or contact:
