10 Nov 2024
Eurex
Focus on VSTOXX® Derivatives | October 2024 recap
- October had a very weak month across all markets with the exception of DAX which was able to withstand the broader movements and end flat
- Implied volatility markets started near the highs of the month, moved to the lows (all of which were in the single digits) ahead of the mid-month ECB meeting, and closed at the highs of the month
- Skew surprisingly ended near the lows of the month while implied volatility ended near the highs, in a divergence that traders may want to take note of
Monthly Volatility Update
The market entered October with two conflicting ideas. First, each of the last two months began with short-term price moves lower for different reasons, yet the market does try to discern patterns such as asset allocation effects. Second, while many market players think October is a month where there are risks of big drawdowns, the seasonal pattern in October (and the rest of Q4) is actually quite positive. So, what would this month bring? The reality ended up being that across Europe, most markets began at the highs and ended at the lows with the exception of the DAX which was relatively flat for the month. Let’s take a look at what this price action meant for the movement and pricing in options markets.
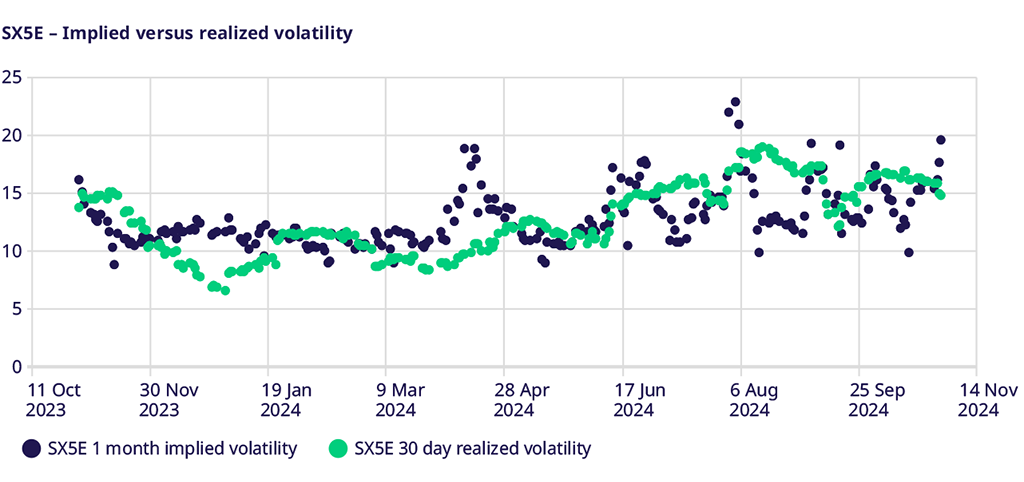
Index prices and volatility were somewhat subdued heading into the mid-month ECB meeting. A cut was expected, but would it materialize? After a late September move higher in realized volatility, SX5E 30-day volatility began heading lower into the ECB meeting. Implied volatility led this move, falling from an early month move up above 17, to a low below 10 before the ECB met. However, even after the expected cut, the weakness of the economic data weighed more on shares, which gave support to the implied volatility market, with SX5E implied closing the month at the highs of the month of 19.48. Middle East concerns and US elections are still top of mind for investors perhaps seeking near-term hedges for their portfolios before Q4 seasonals can resume their impact.
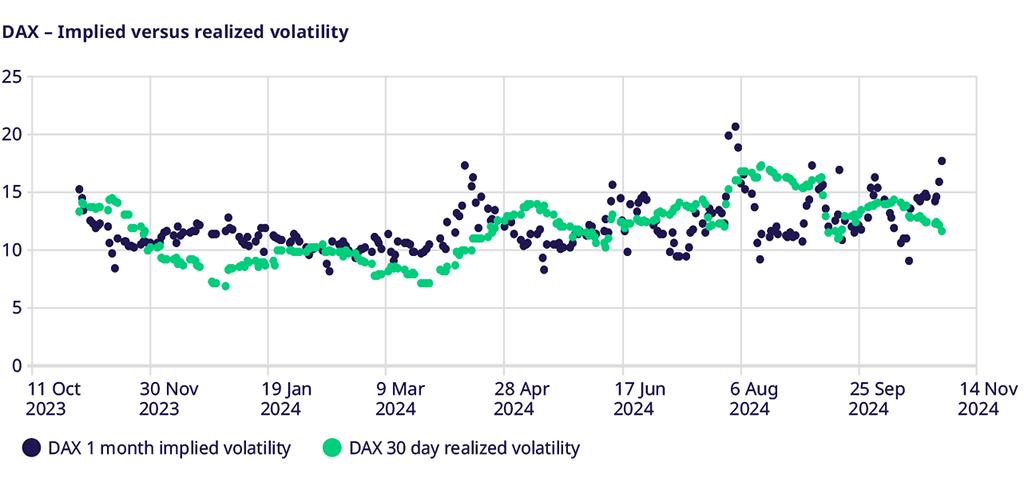
While DAX implied and realized volatility followed a similar path to the SX5E Index, it wasn’t as much because of the index price action. On a relative performance basis, DAX ground higher vis a vis SX5E throughout the month of October. This relative performance was from DAX, which was holding steady while SX5E eroded. DAX options saw implied volatility hit 16 early in the month before heading lower and registering levels below 9 mid-month, only to close the month at the high of 17.5, all with a flat index. Realized volatility was not the driver as it closed the month much as it began, thus the implied to realized spread widened, perhaps motivated by the same potential risks seen in other equity markets.
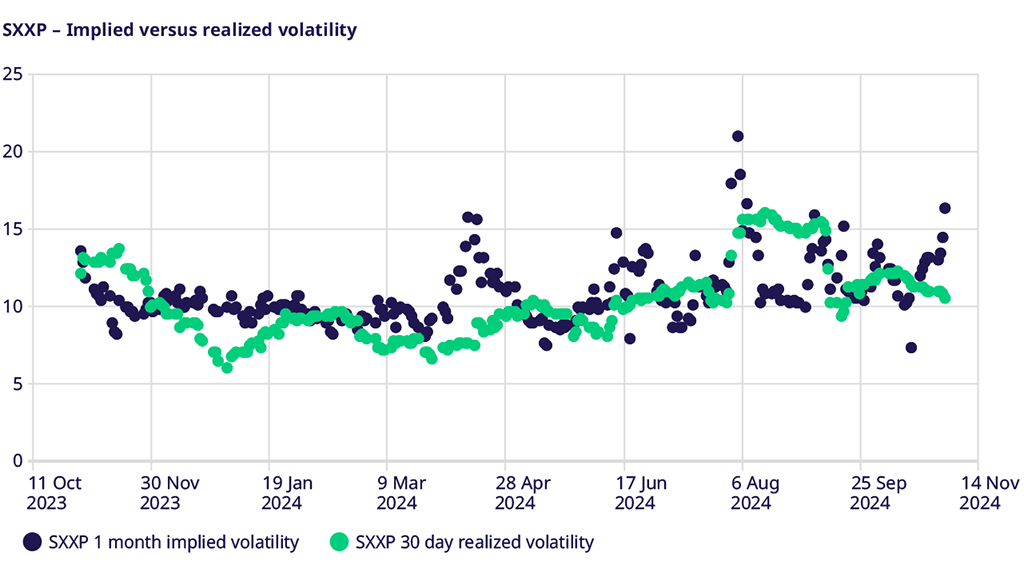
SXXP markets had the same pattern, but with more extreme outcomes. Rolling 30-day realized volatility began at 11.5, moved to a high of 12 but closed the month at 10.5. It was not realized volatility driving the implied volatility market. Implied vols started the month at 13 and traded a small amount higher, before hitting lows near 7 in the middle of the month. Vols did not stay there and rallied to close the month just over 16 with many catalysts on the horizon, from a macro and micro perspective.
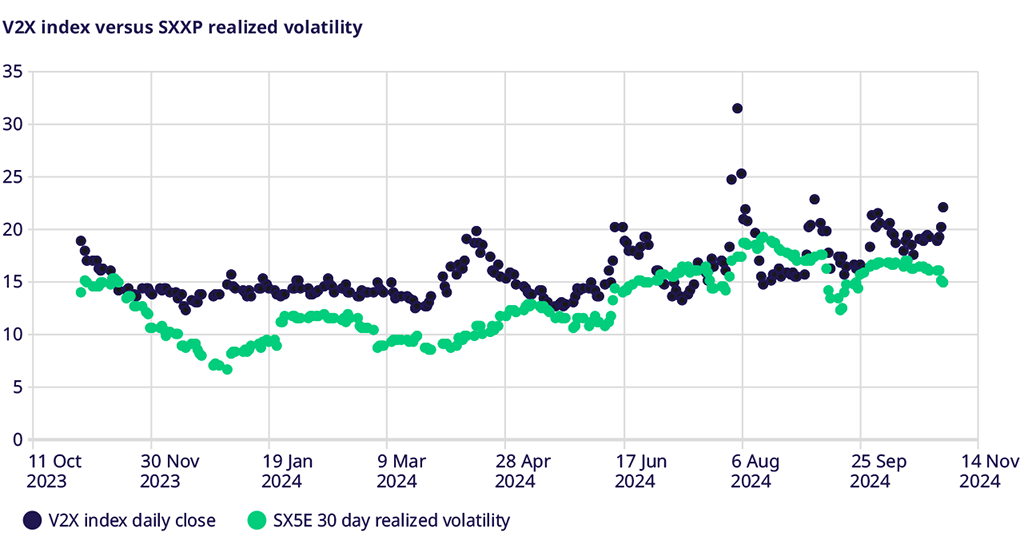
V2X traded in a 17.25-21.25 range throughout the month, beginning near the highs of the month, trading to the lows mid-month, and ending at the highs of the month much like all other options markets. With earnings beginning in earnest mid-month, and the busiest week of the month in the last week, including many mega-cap tech names reporting, investors were getting a sense of what micro risks were in the market, and whether or not there was a need to hedge. As markets moved to the lows of the month, vol markets responded in kind and moved back to the high levels seen. We saw the implied to realized spread also widen out, suggesting a level of nervousness that is sometimes masked in the moves of the headline V2X index.
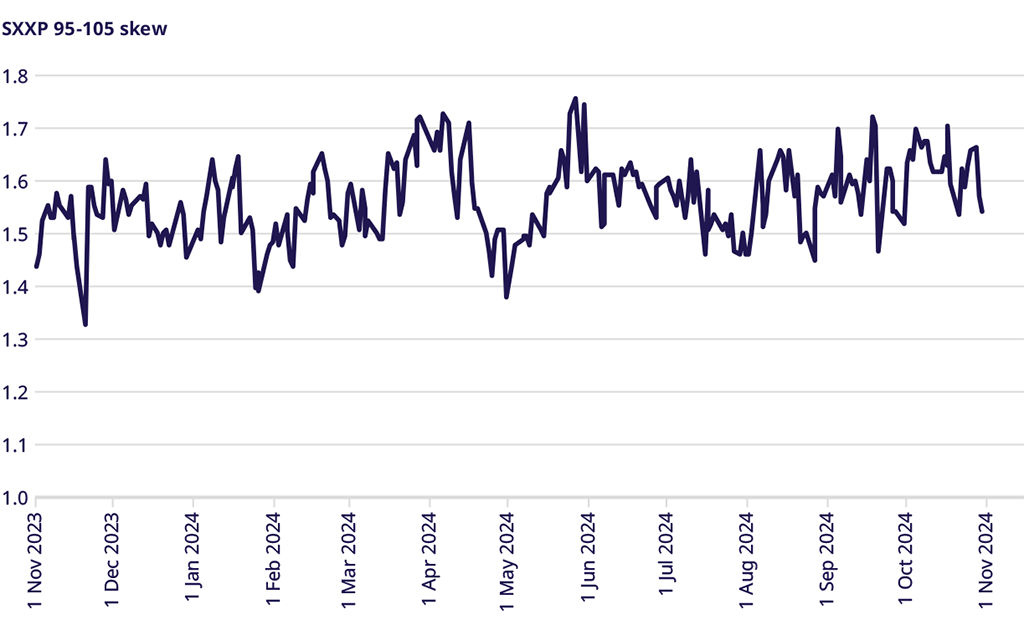
As implied volatility moved higher, and markets moved lower, we perhaps surprisingly saw Skew move to the lows of the month as October ended. Was this because V2X moved higher because of vol by strike dynamics, but sticky strike was actually coming lower? Were some investors in fact taking hedges off on the move? Either explanation is possible, but what may be clear from the move in skew is that it was not necessarily a demand for downside options that was driving the move in the V2X Index. Maybe this suggests that V2X move is near a tradable high after the earnings and election catalysts are out of the way. Either way, it is a noticeable divergence in the markets.
Trade the European volatility benchmark
Explore this year's macro events and find an overview of dates.
Volatility Views Podcast
Listen to the newest edition of the podcast by "The Options Insider" and get more information on this week's volatility markets and the VSTOXX® review and outlook.
For more information, please visit the website or contact:
